The Geomorph's Fourier Explorer

What is the Fourier Explorer?

The Fourier Explorer is a tool provided by Geomorph for processing a height field with the Fourier transform. It allows to fine tune the frequencies of the height field, or of any other image editable with Geomorph, and to see the result on-the-fly.

What are the frequencies of an image?

Consider a frequency as a level of detail. High frequencies (or short wave lengths) mean tiny details, low frequencies (or large wave lengths) mean huge structures.

What is a Fourier transform?

Joseph Fourier (1768-1830) is a French mathematician who postulated that any function can be decomposed in a sum of simple periodic functions, like sine or cosine. A sum of this kind is called a Fourier series.

So, a Fourier transform takes data in the "spatial domain" (a sound, a picture, a height field, whatever else), and transforms it in the "frequency domain", which refers to the sum of periodic functions.

It's easier to understand with a recognizable image than with a height field, so we'll show it with the picture of Bouboule the Cat.


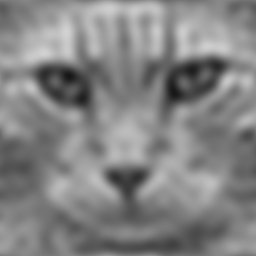
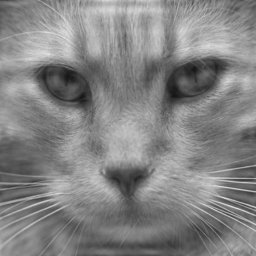
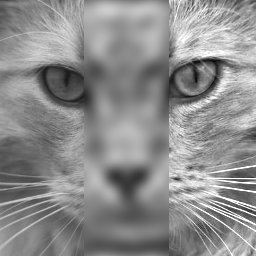
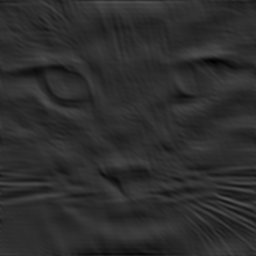
The "spatial domain" of Bouboule the Cat
Right-click on the image to download a 512x512 16-bit png version, usable in Geomorph.

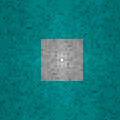
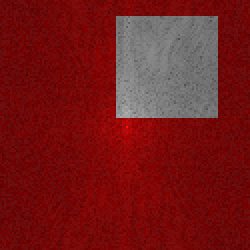
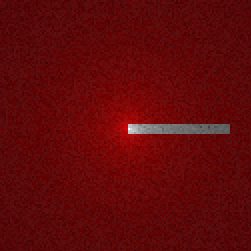
The "frequency domain" of Bouboule the Cat
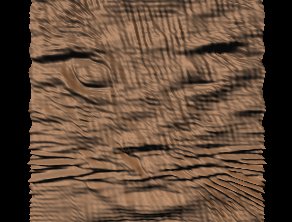
A displayable representation of the Fourier transform is shown at right. Actually, the center of the image coincide with the (0,0) coordinate of the result. It's usual to translate it half its size for centering the area having the most relevant information for the look of the original image. The center corresponds to the lowest frequency.

If you apply an inverse Fourier transform to the frequency domain, you'll get back the spatial domain.

A Fourier transform decomposes an image in its frequencies, but you can also compose an image from chosen frequencies. See this principle at work here, where an "egg box" height field is generated. This image will be used in this tutorial, beside Bouboule the Cat and the usual default Geomorph height field.


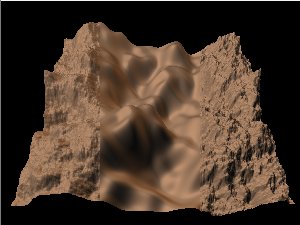
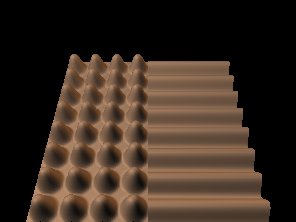
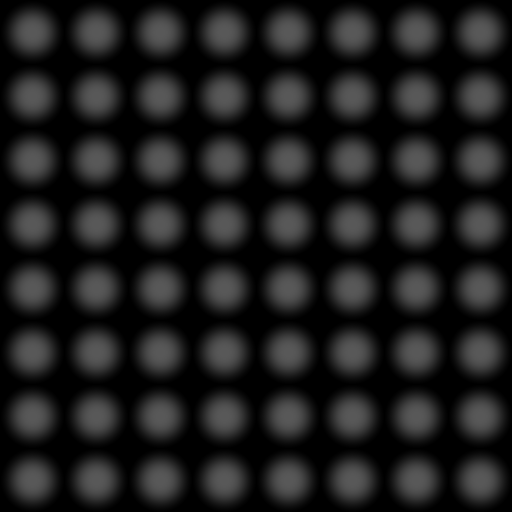
The "Egg Box" height field used in this tutorial.


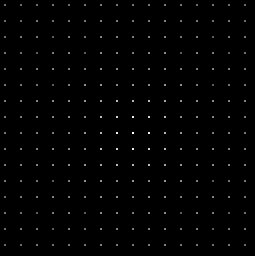
The frequency domain of this image. Notice how the dots are regularly spaced. One would expect less dots, because there is apparently only one frequency. Actually the dimmer dots can be compared to the harmonics of a musical note.


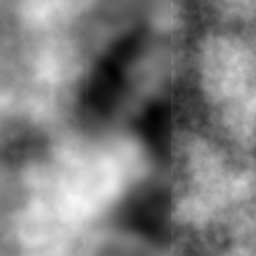
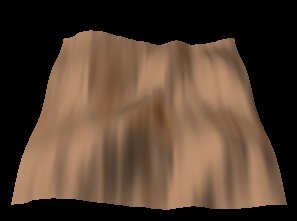
The "default" Geomorph height field...

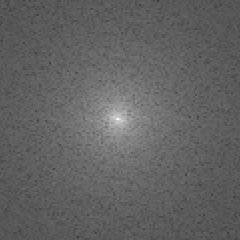
... and its frequency domain. Since the spatial domain was generated with a pseudo-random process, the frequencies are more uniformly distributed than in the two other images.
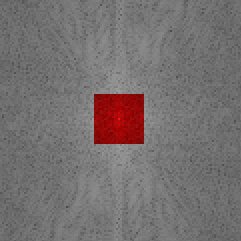

What can be done with a Fourier transform?

Basically:
All of this can be done with the Fourier Explorer, using a mask filter over the frequency domain.

A few things useful to know about the Fourier Explorer interface

... instead of discovering them by trial-and-error
  1. The Fourier Explorer is a modal dialog. The Geomorph document regular windows are not responsive when using it. You have to quit the Fourier Explorer window before working in any other Geomorph window. For the same reason, when rendering the result of the Fourier transform, you have to click on the POV-Ray icon in the Fourier window, not the one in the document window - it's easy to click the wrong one!
  2. When you quit the dialog by closing the window, the changes you made are not kept. You need to click the "Keep and quit" button to confirm your changes.
  3. The "Preview choice" is what you keep when you quit the dialog. So, if you switched from the spatial view to the frequency view, the current height field would be replaced by a view of the frequency domain. This is a feature, for those who want to use the frequency domain representation as a terrain. You can undo this change in the document window, like any other change.
Using the mask filter

The mask filter is controlled by this tool bar, in the Fourier Explorer dialog:

The principle is simple:  the red area of the mask, adjusted with sliders, is removed from the frequency domain before applying the inverse Fourier transform.

Let's see how it works over Bouboule the Cat:

The block filter
(1)
Block

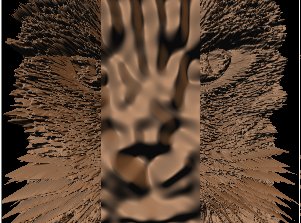
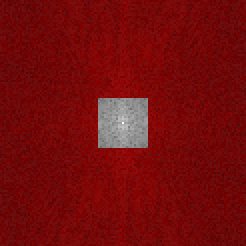
The "Block" mask set at a 5% level over width and depth. Only the lowest frequencies, at the center, are kept. This smooths the image.
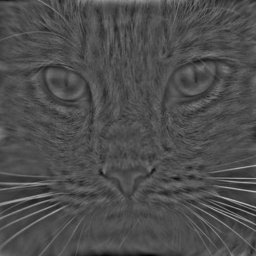
The Frame filter
(2)
Frame

The "Frame" mask set at a 5% level. Only the higher frequencies (the details) are kept. It equals the original image, minus the smoothed image (1).
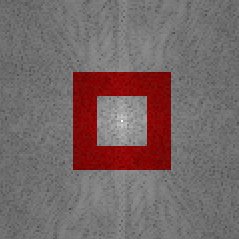
The Empty Box filter
(3)
Empty
Box

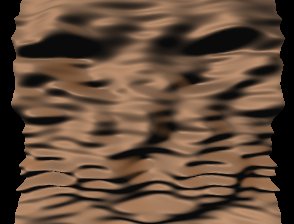
Mask set at a 5% level over width and depth, band size also at 5%. Only medium frequencies are kept.
The Ditch filter
(4)
Ditch

Mask and band are set at 5% the size of the frequency map. The result equals the original image, minus the medium frequencies (3).

Notice that the masked frequency images are blown up, as they are in the Fourier Explorer window, because the most relevant frequencies for the eye are in the center.


And there is more: the amplitude of the mask can be adjusted to reduce the effect. Furthermore, the amplitude can be negative. In that case, the mask becomes blue and the effect is reverted. For instance, if the blue mask is applied on the higher frequencies, the image will look sharper - or noiser if it's an height field.

The block mask with a negative amplitude.

 
Effect of the negative amplitude (block mask at 5%)

The first slice of the image is the original one, the second slice shows the effect of the mask with a 100% amplitude, the third slice shows the effect of a -100% amplitude.


Using an asymetrical mask

For those who want to explore unusual effects, the mask can be off-center, and it can have a rectangular shape instead of square.

To move the mask, adjust the +X and +Y sliders.

To make it rectangular, uncheck the equal sign at the right of the "Width" and "Depth" sliders, which binds these sliders, and move them as required.


A rectangular mask with a 2% width and a 10% depth.

An off-center 10% mask, +X=6%, +Y=5%.

Width=10%, depth=1%, +X=5%, with the default height field.

Width=0% (1 pixel), depth=10%, over the "egg box" image.

Source at left, result at right: we can see that the horizontal waves are removed.


Other features of the interface

The real and the imaginary parts

The frequency domain view shows 3 tabs, called "Real", "Imaginary" and "Magnitude". The result of a Fourier transform is a complex number, with a real part and an imaginary part. The imaginary part is composed by a coefficient multiplied by the square root of -1. The real part is related to the amplitude of the wave, the imaginary to its phase. The magnitude (or module), which is usually displayed when showing the result of a Fourier transform, is given by square_root( real2 + imaginary2 ). Given that the imaginary number is represented in a cartesian plane, X being the real part and Y being the imaginary part, the magnitude is the length of the vector starting from (0,0) to (real, imaginary), calculated with the Pythagoras formula.

What can be done with those tabs? The mask is only applied on the shown tab. So, for instance, if you mask all the frequency domain with a 100% block mask and choose the "imaginary" tab, the result would contain only the effect of the real part.

The "Reuse result" button

The "Reuse result" button takes the inverse Fourier transform, generated after applying the current filter and displayed in the preview image, and replaces the input image with it, so that you can apply a new filter without going back to the Geomorph document window.

Links

Here are some links that explain more thouroughly the concepts related to the use of Fourier transforms with images.

Image Transforms - Fourier Transform
Fourier Image Analysis
Fourier transform
Fourier transform theory
Fourier transform - Wikipedia, the free encyclopedia
Introduction to the frequency domain

Written in April 2008

Contact:    Patrice St-Gelais


SourceForge.net Logo